From insight to action: prescriptive analytics in Mitigate
Part three of three. Once you know where fire will go, the question becomes what to do about it.

Kevin Bonner
Once you understand the fire risk across your landscape (descriptive analytics) and can model where and how fires are likely to spread (predictive analytics), the final step answers the most important question: what should we do about it?
This is where prescriptive analytics come in — helping land managers, planners and infrastructure owners choose the best mitigation strategies, backed by data.
What prescriptive analytics are
Prescriptive analytics guide decisions by evaluating different intervention options and predicting their outcomes. In Mitigate that means building, testing and refining treatment strategies, so every action taken is informed, targeted and effective.
Where descriptive analytics show you the state of the land, and predictive analytics show where fire might go, prescriptive analytics offer recommendations and validation for action.
Treatment strategies
Mitigate lets users plan and compare a range of mitigation treatments:
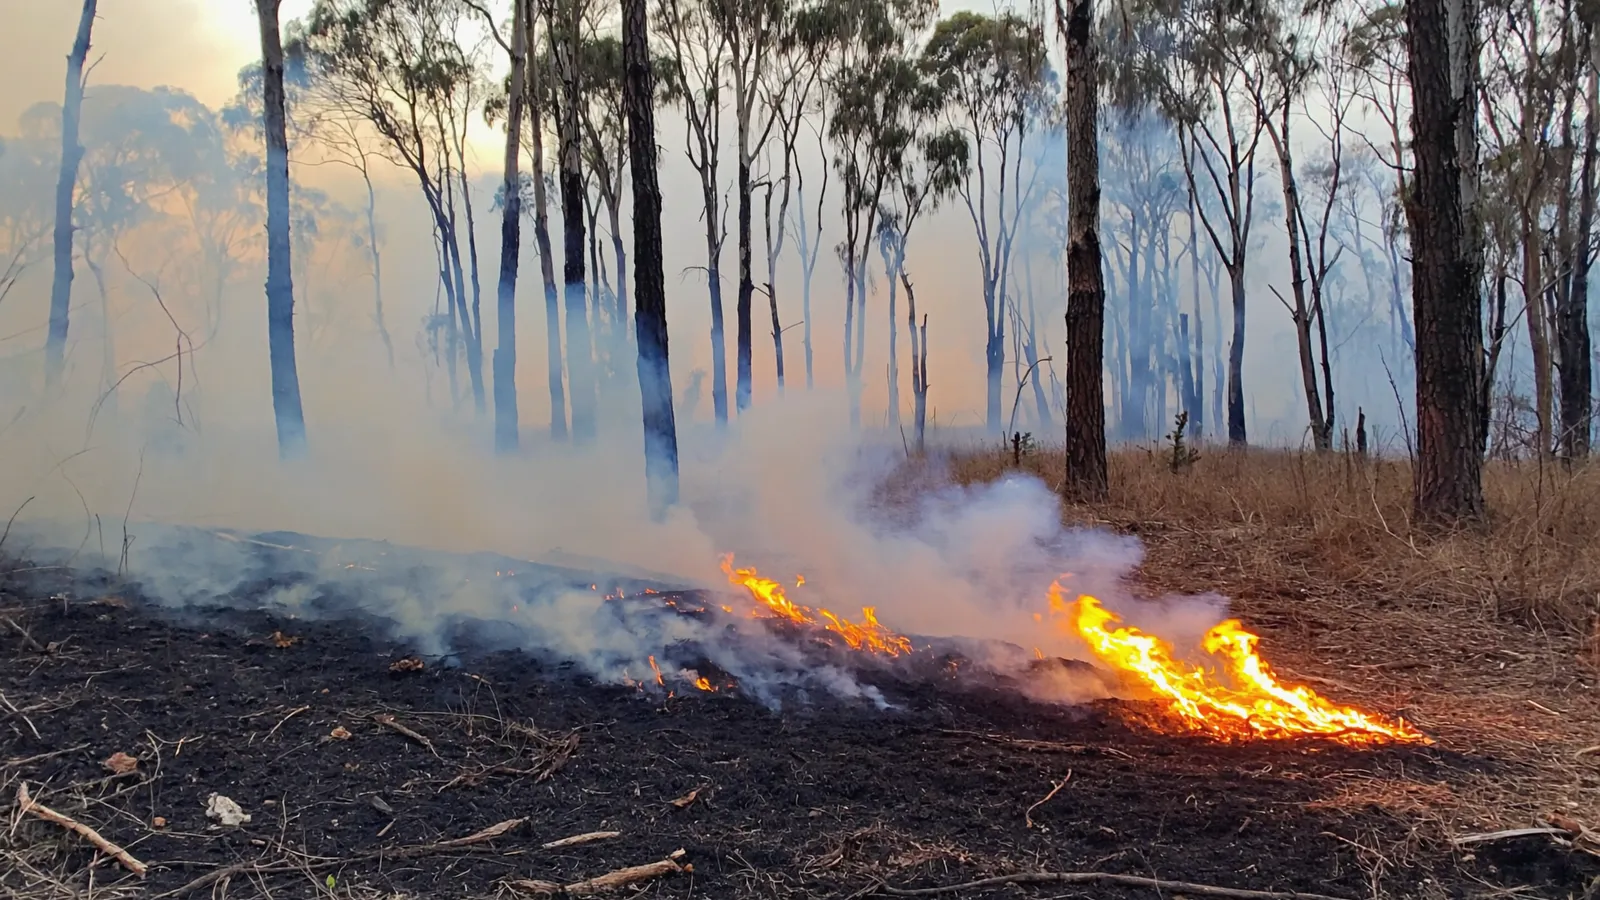
- Prescribed burning — reduce fuel load in strategic locations with controlled fire.
- Mechanical intervention — remove or reduce vegetation using slashing, thinning or other mechanical means.
- Grazing — use livestock to manage fine fuels such as grass and leaf litter, especially in transitional zones.
- Revegetation and green firebreaks — establish low-flammability vegetation or natural buffers that slow or redirect spread.
These can be mapped, sequenced and prioritised, letting land managers coordinate both immediate actions and long-term strategies across a property or region.
Testing and validating strategies
What sets prescriptive analytics apart is the ability to test strategies against predictive models — seeing how different treatments reduce risk over time and under different weather.
That means answering questions like:
- If we implement a burn here, will it protect this asset?
- Is mechanical clearing or grazing more effective in this zone?
- How much risk reduction do we achieve in year one versus year five?
Users can also explore cost-benefit trade-offs, resource allocation and seasonal constraints, building a realistic, defensible plan that aligns with both ecological and operational objectives.
Short-term wins and long-term resilience
Prescriptive analytics don’t just help plan next season’s works — they support multi-year strategic planning to reduce long-term exposure. That’s particularly valuable for carbon project developers reducing emissions from fire, utilities protecting critical infrastructure, conservation groups managing fire-adapted landscapes, and local governments with community protection mandates.
The outcome: smarter, targeted treatments that are proactive instead of reactive, based on the landscape’s risk profile and the user’s tolerance for exposure.
From planning to action
Mitigate gives users a clear pathway from data to decision — develop actionable treatment plans, justify decisions with risk-reduction evidence, communicate plans with stakeholders and monitor progress against long-term goals.
Prescriptive analytics bring it all together, connecting data, models and treatments so users can act with confidence and build resilience over time.