Understanding descriptive analytics in bushfire mitigation
Part one of three. Before you can model anything, you have to know what is actually there.

Kevin Bonner
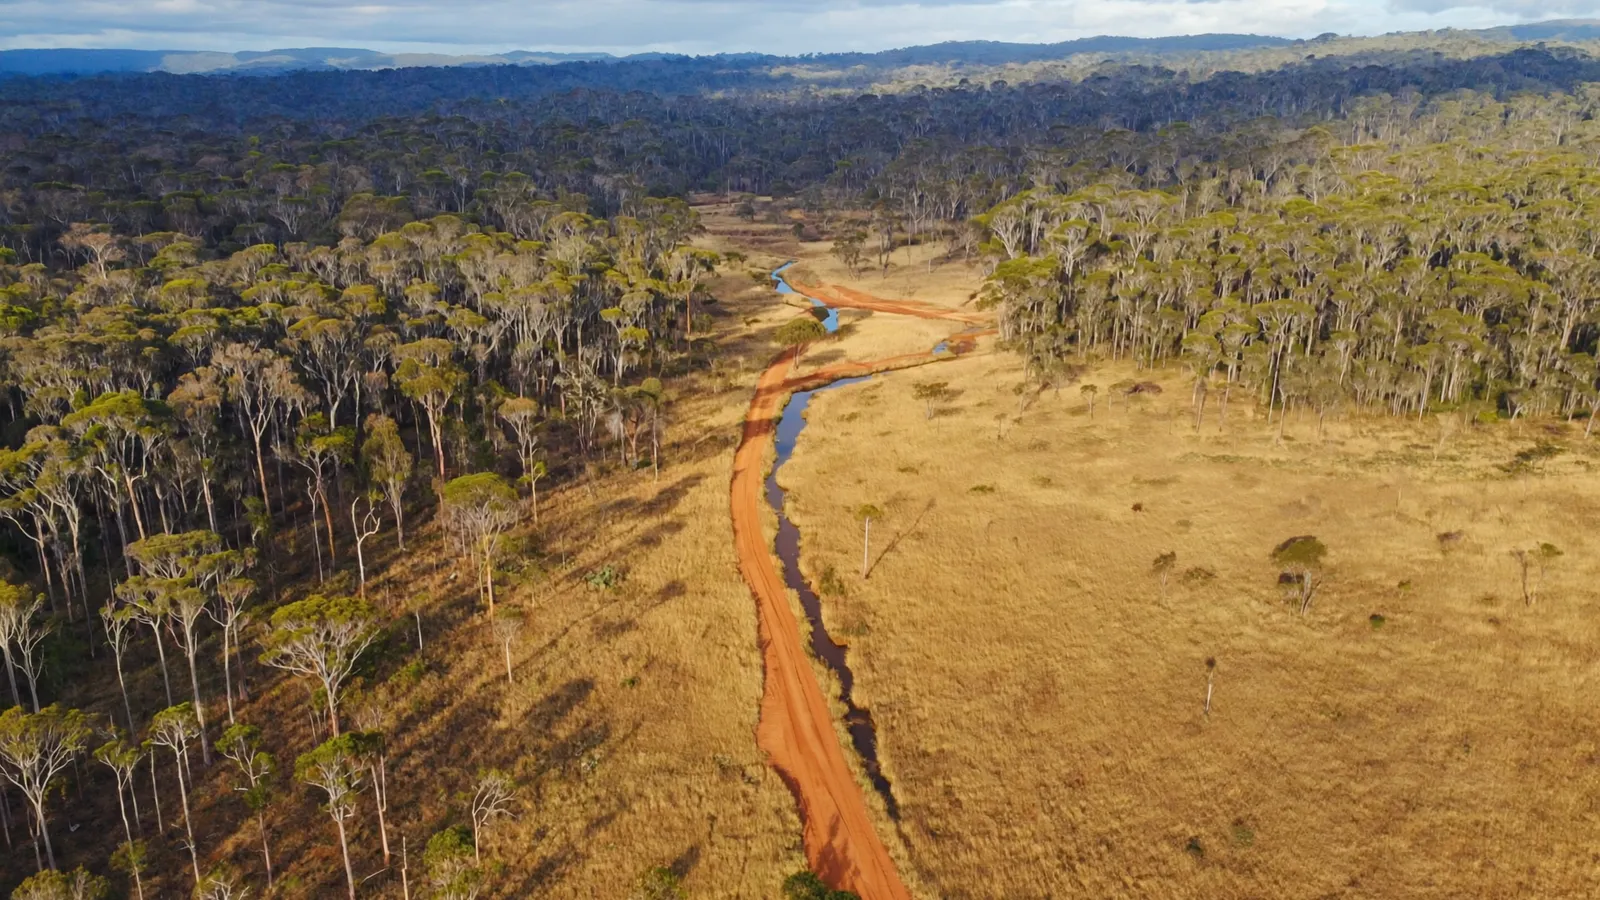
When it comes to bushfire risk, the first and most foundational step in building an effective mitigation plan is understanding the landscape as it is today — and how it has behaved in the past.
At FiSci we call this layer descriptive analytics.
What descriptive analytics are
Descriptive analytics are the data layers that help land managers, infrastructure owners and emergency planners interpret the condition of their landscape. That includes both static and historical datasets, displayed through spatial visualisations.
In Mitigate they include:
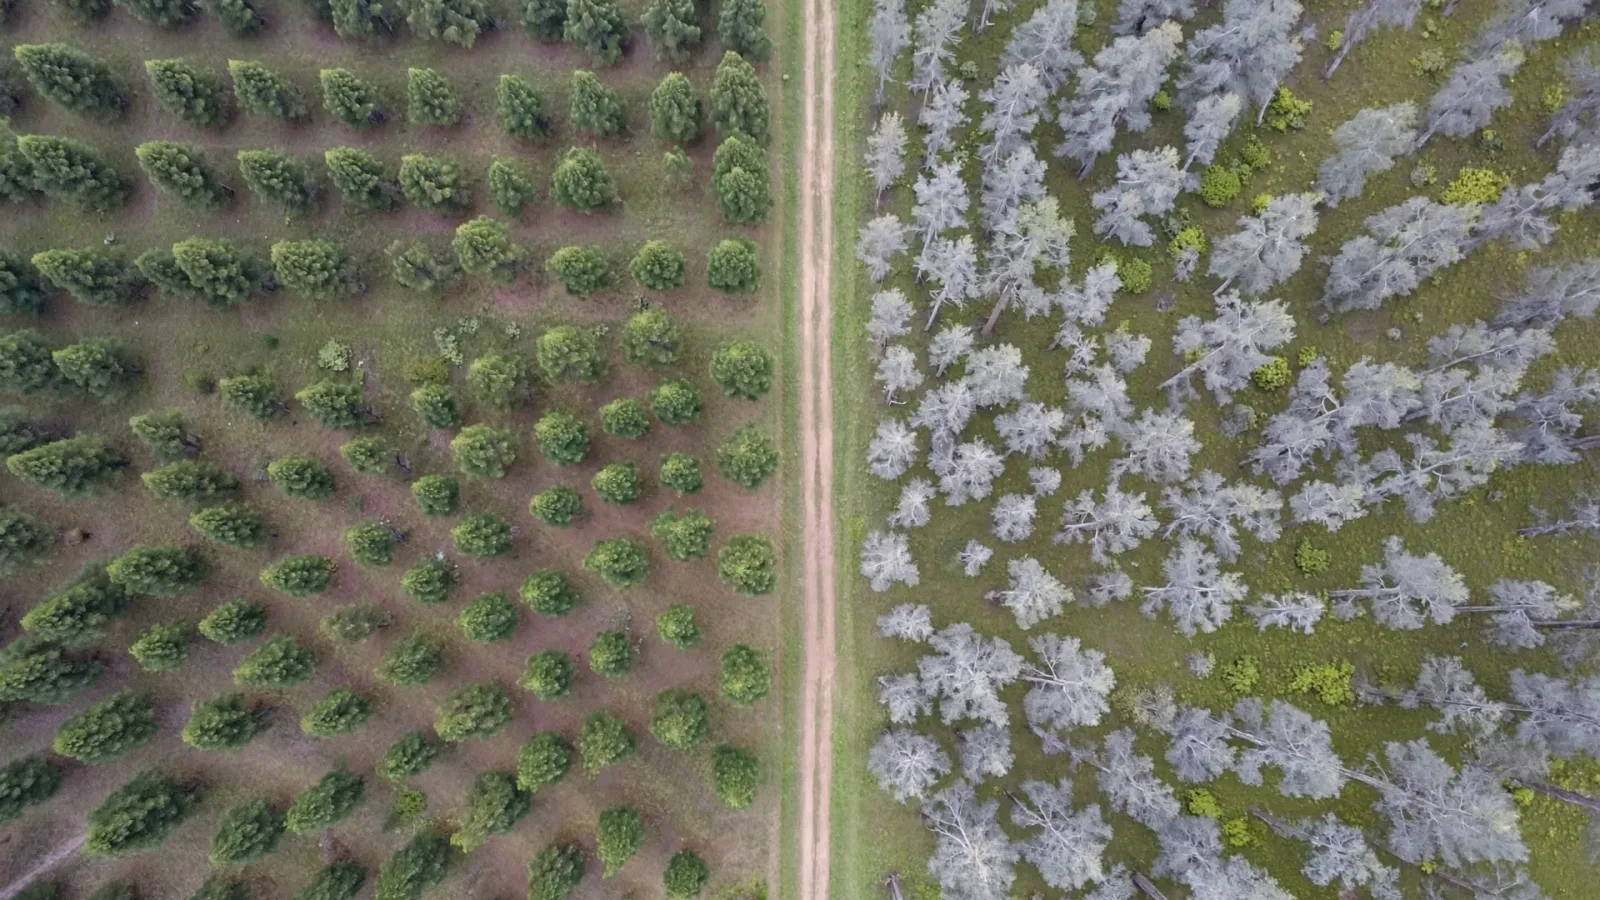
- Vegetation communities. Different vegetation types carry different fuel loads, burn behaviours and recovery times. Mapping these is the first step in understanding risk.
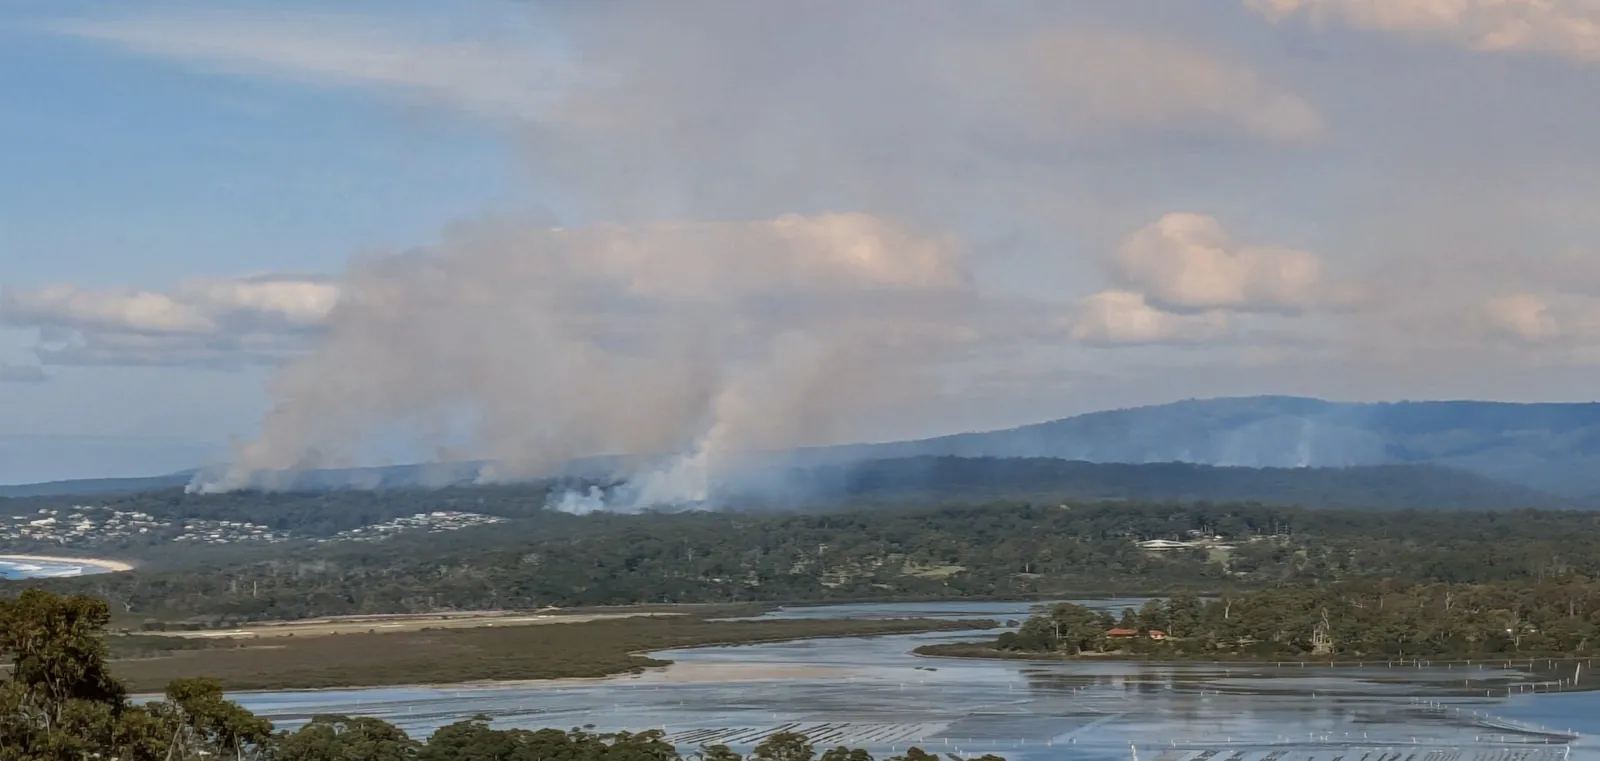
- Fire history. Where have fires occurred? How frequently do they return? Understanding ignition density and burn patterns helps identify high-risk zones.
- Fuel load. Built-up ground fuels and ladder fuels are a key driver of intensity and spread. Tracking this identifies areas that require active treatment.
- Topography and geography. Elevation, slope and aspect all influence how a fire behaves, providing the spatial context for planning.
Why it matters
Descriptive analytics are the baseline for everything that follows. They help users identify high-risk areas and asset exposure, prioritise areas for fuel treatment, understand changes over time in landscape condition, and communicate risk clearly with stakeholders.
But there’s a caveat.
The risk of human bias
Descriptive data is powerful — but used in isolation it carries the greatest risk of subjective interpretation. Without predictive or prescriptive modelling, users are left to make assumptions, or lean on past experience, when assessing how dangerous a fuel load is or how close a fire might get to key assets.
That can lead to overreliance on certain datasets, or missed signals in others.
Which is why our approach doesn’t stop at descriptive analytics. It forms one layer of a more complete decision-making framework.
Laying the groundwork
By providing clean, well-structured and transparent descriptive data, we let users move confidently into the next stages: predictive and prescriptive analytics. Those deeper layers let us simulate fire behaviour, model risk scenarios and stress-test treatment strategies.
For now the message is simple: if you want to make smarter fire management decisions, start by understanding what’s already there.