
A Shield of Fire on the Far South Coast
A Shield Of Fire
How a coordinated autumn burn program by FCNSW, RFS and NPWS quietly took thousands of asset-impact events off the table for the Far South Coast’s next fire season — measured in FiSci Mitigate against the worst fire weather the region has run into since Black Summer.
The day we are planning for
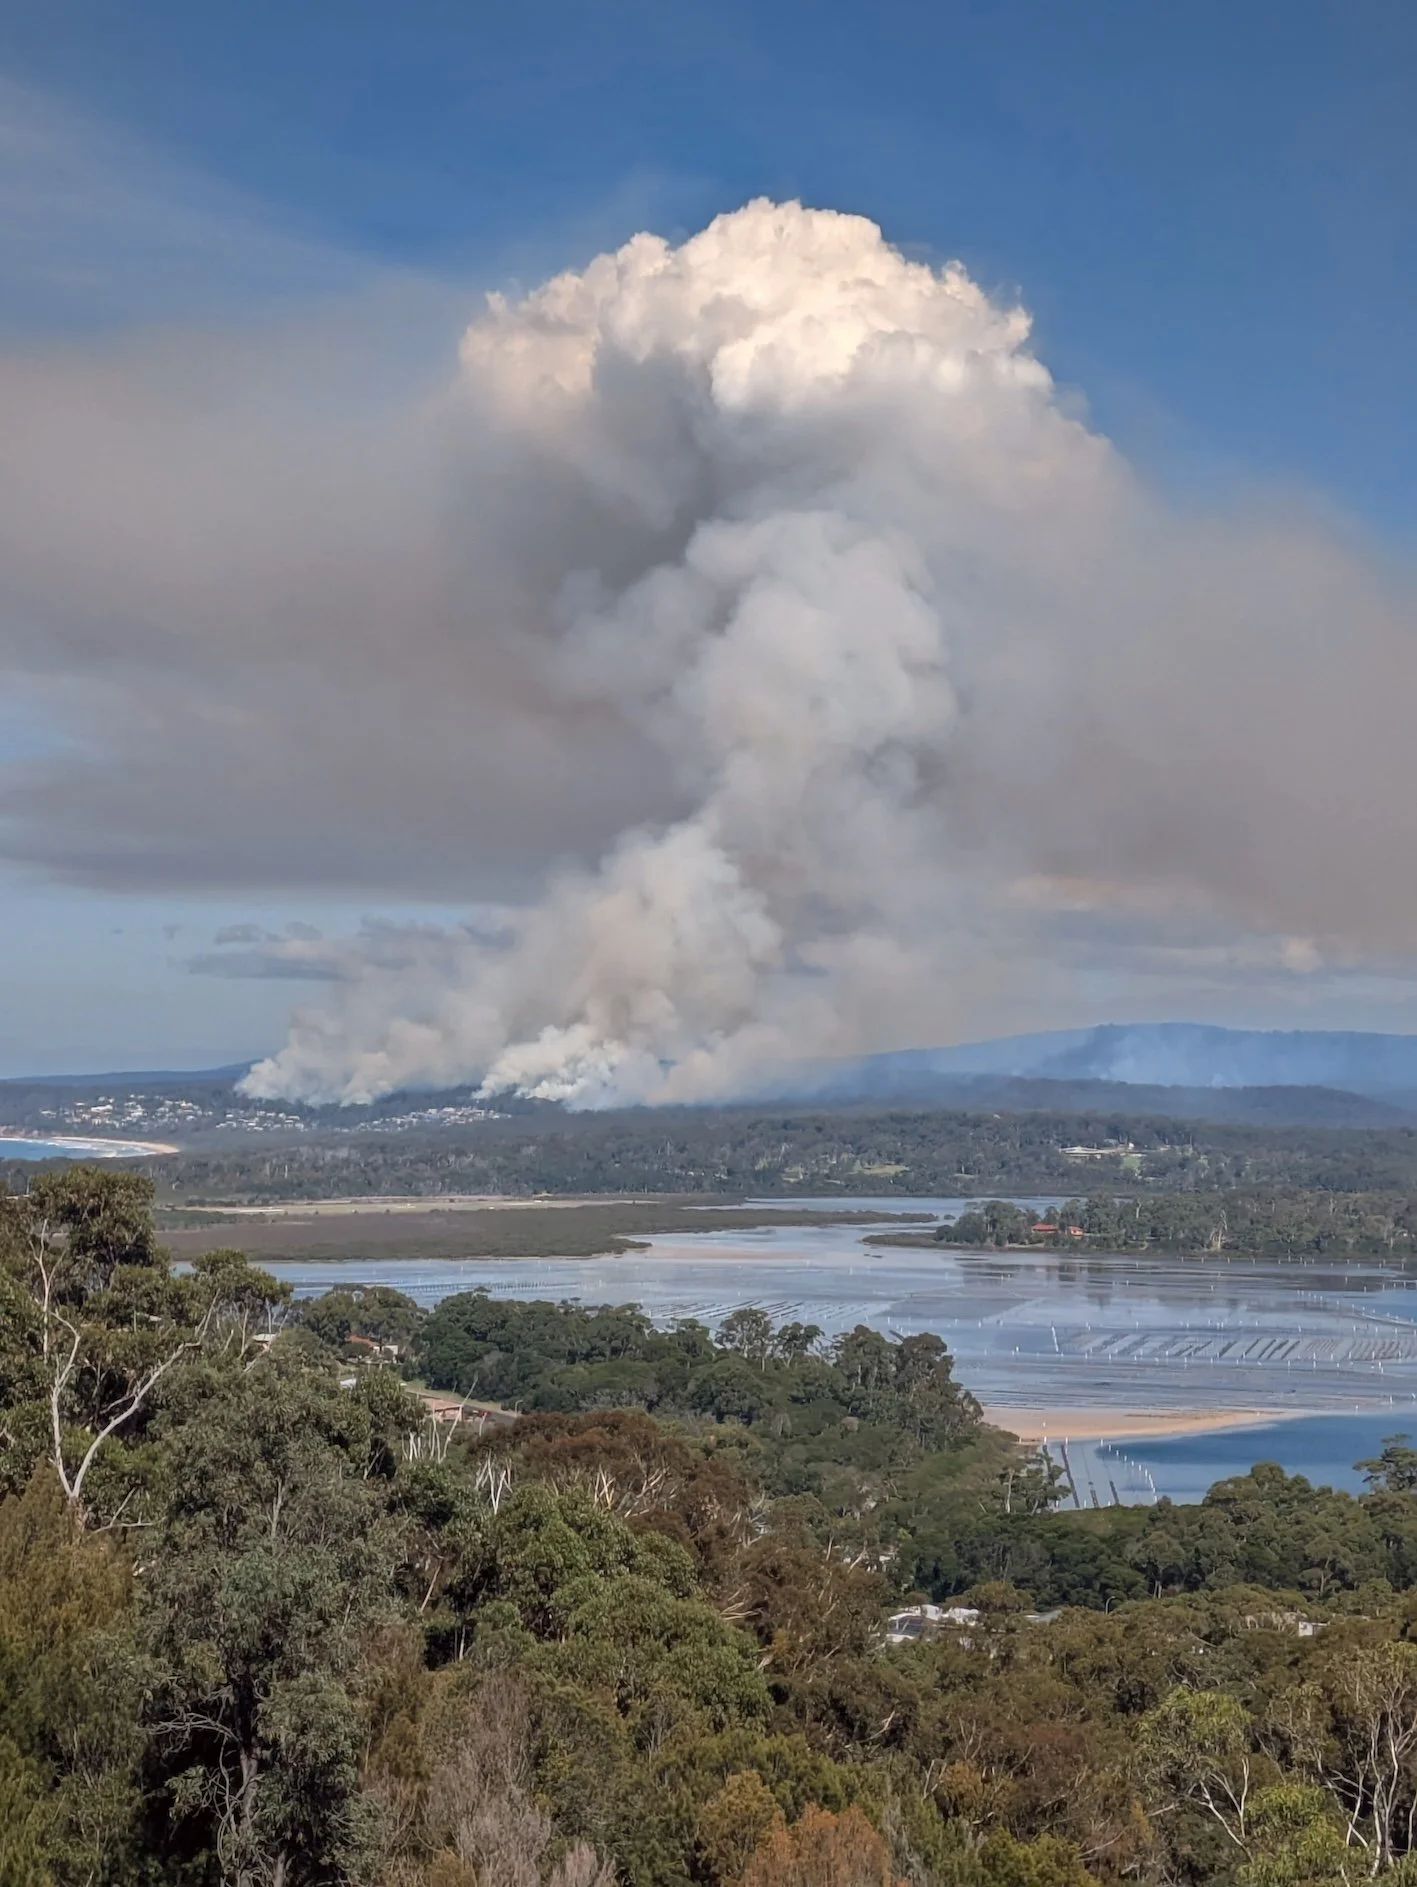
The smoke columns seen around the district in October 2023 are the kind of image you don’t want to see twice. The Coolagolite fire was the worst fire weather the Far South Coast had seen since Black Summer — north-westerlies gusting to 100 km/h, temperatures pushing 30 °C, humidity collapsing into the teens, and a landscape in drought. We don’t know when those conditions will line up again. We do know they will.
Smoke billows from the Coolagolite bushfire, viewed from Tanja at roughly 3pm on October 3, 2023.
This autumn, fire crews from Forestry Corporation of NSW (FCNSW), the NSW Rural Fire Service (RFS) and National Parks and Wildlife Service (NPWS) ran one of the most consequential hazard reduction programs the region has seen. Multiple burns, totalling more than one thousand hectares, threaded through reserves and state forests behind Merimbula, Tura Beach, Pambula, Bournda and Towamba.
It’s the kind of footprint that’s easy to under-rate from a satellite view. Until you re-run the worst day on record over the new landscape and watch what happens.

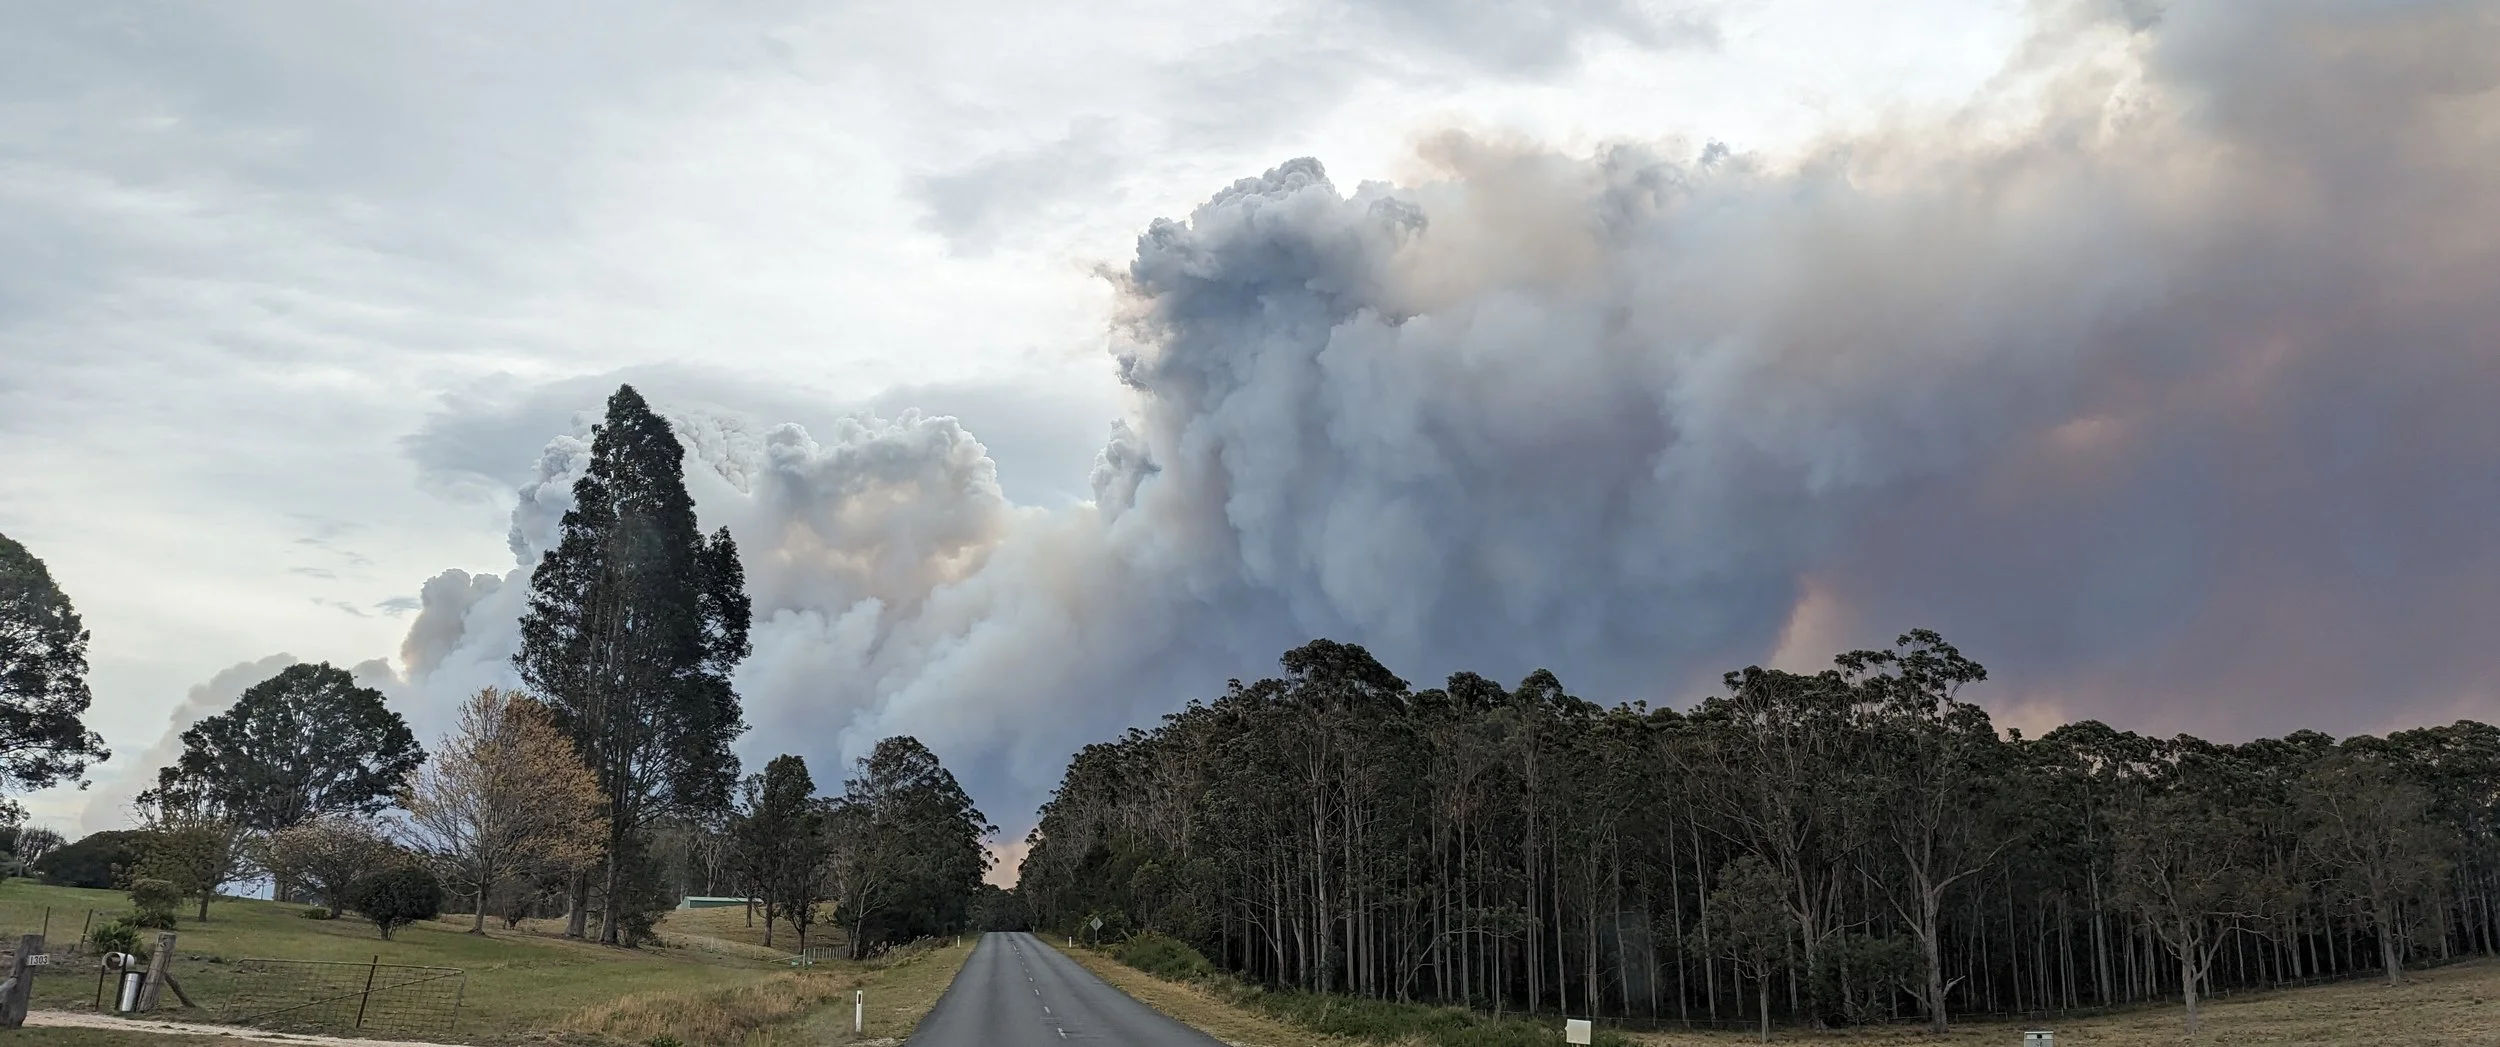
Columns rise from planned burns in the Far South Coast bushland. Mild conditions on the ground; serious risk reduction overhead.
How we measured it
We rebuilt the Coolagolite event in FiSci Mitigate at high resolution across the Far South Coast. The modelled scenario carries 13,105 mapped assets, every fuel class, every aspect, and every gully. We then ran almost one thousand hypothetical ignitions across that landscape under the exact 3 October 2023 weather profile. Each ignition is allowed to develop for eight hours of physical fire-behaviour simulation.
Then we ran the same ignitions a second time, with the 12 autumn 2026 hazard reduction burns inserted into the landscape exactly as they were laid down on the ground.
The two outputs are directly comparable. The differences are entirely attributable to the burns.
| Reference event | Coolagolite Bushfire — 3 October 2023 |
| Wind direction | NW (314–355°) |
| Peak wind speed | 47.5 km/h (gusts to 100km/h) |
| Temperature | Up to 30 °C |
| Relative humidity | Down to 15% |
| Simulation duration | 8 hours per ignition |
| Ignitions tested | 729 across the planning area |
The numbers
Across 729 ignitions, the picture is consistent: smaller fires, fewer impacted assets, lower landscape risk.
| Metric | No mitigation | With 2026 HRs | Change |
|---|---|---|---|
| Average area burnt per ignition | 2,337.56 ha | 2,176.37 ha | −161 ha (−6.9%) |
| Average impacted assets per ignition | 230.86 | 212.96 | −18 (−7.8%) |
| Landscape asset impact rate | 1.76% | 1.63% | −0.14 pp |
| Total asset-impact events across 729 ignitions | ≈168,300 | ≈154,600 | ≈13,700 fewer |
Across the full regime, the burns prevented the equivalent of roughly 13,700 individual asset-impact events — homes, sheds, powerlines and infrastructure that would otherwise have sat inside lethal flame and intensity contours. That is an 8% reduction in expected losses from treating a tiny fraction of the landscape footprint. The localised wins are larger again.
Bournda Nature Reserve: a single block, a whole neighbourhood
The most striking individual result is the burn in the Bournda Nature Reserve, sitting north-west of Tura Beach.
In the no-mitigation simulation, an ignition inside the reserve develops a strong NW-driven head fire and runs straight down through the bush onto Tura Beach. Most of the western half of the suburb lights up red on the asset impact layer — predicted heat exposure above the survivability threshold for the homes there.
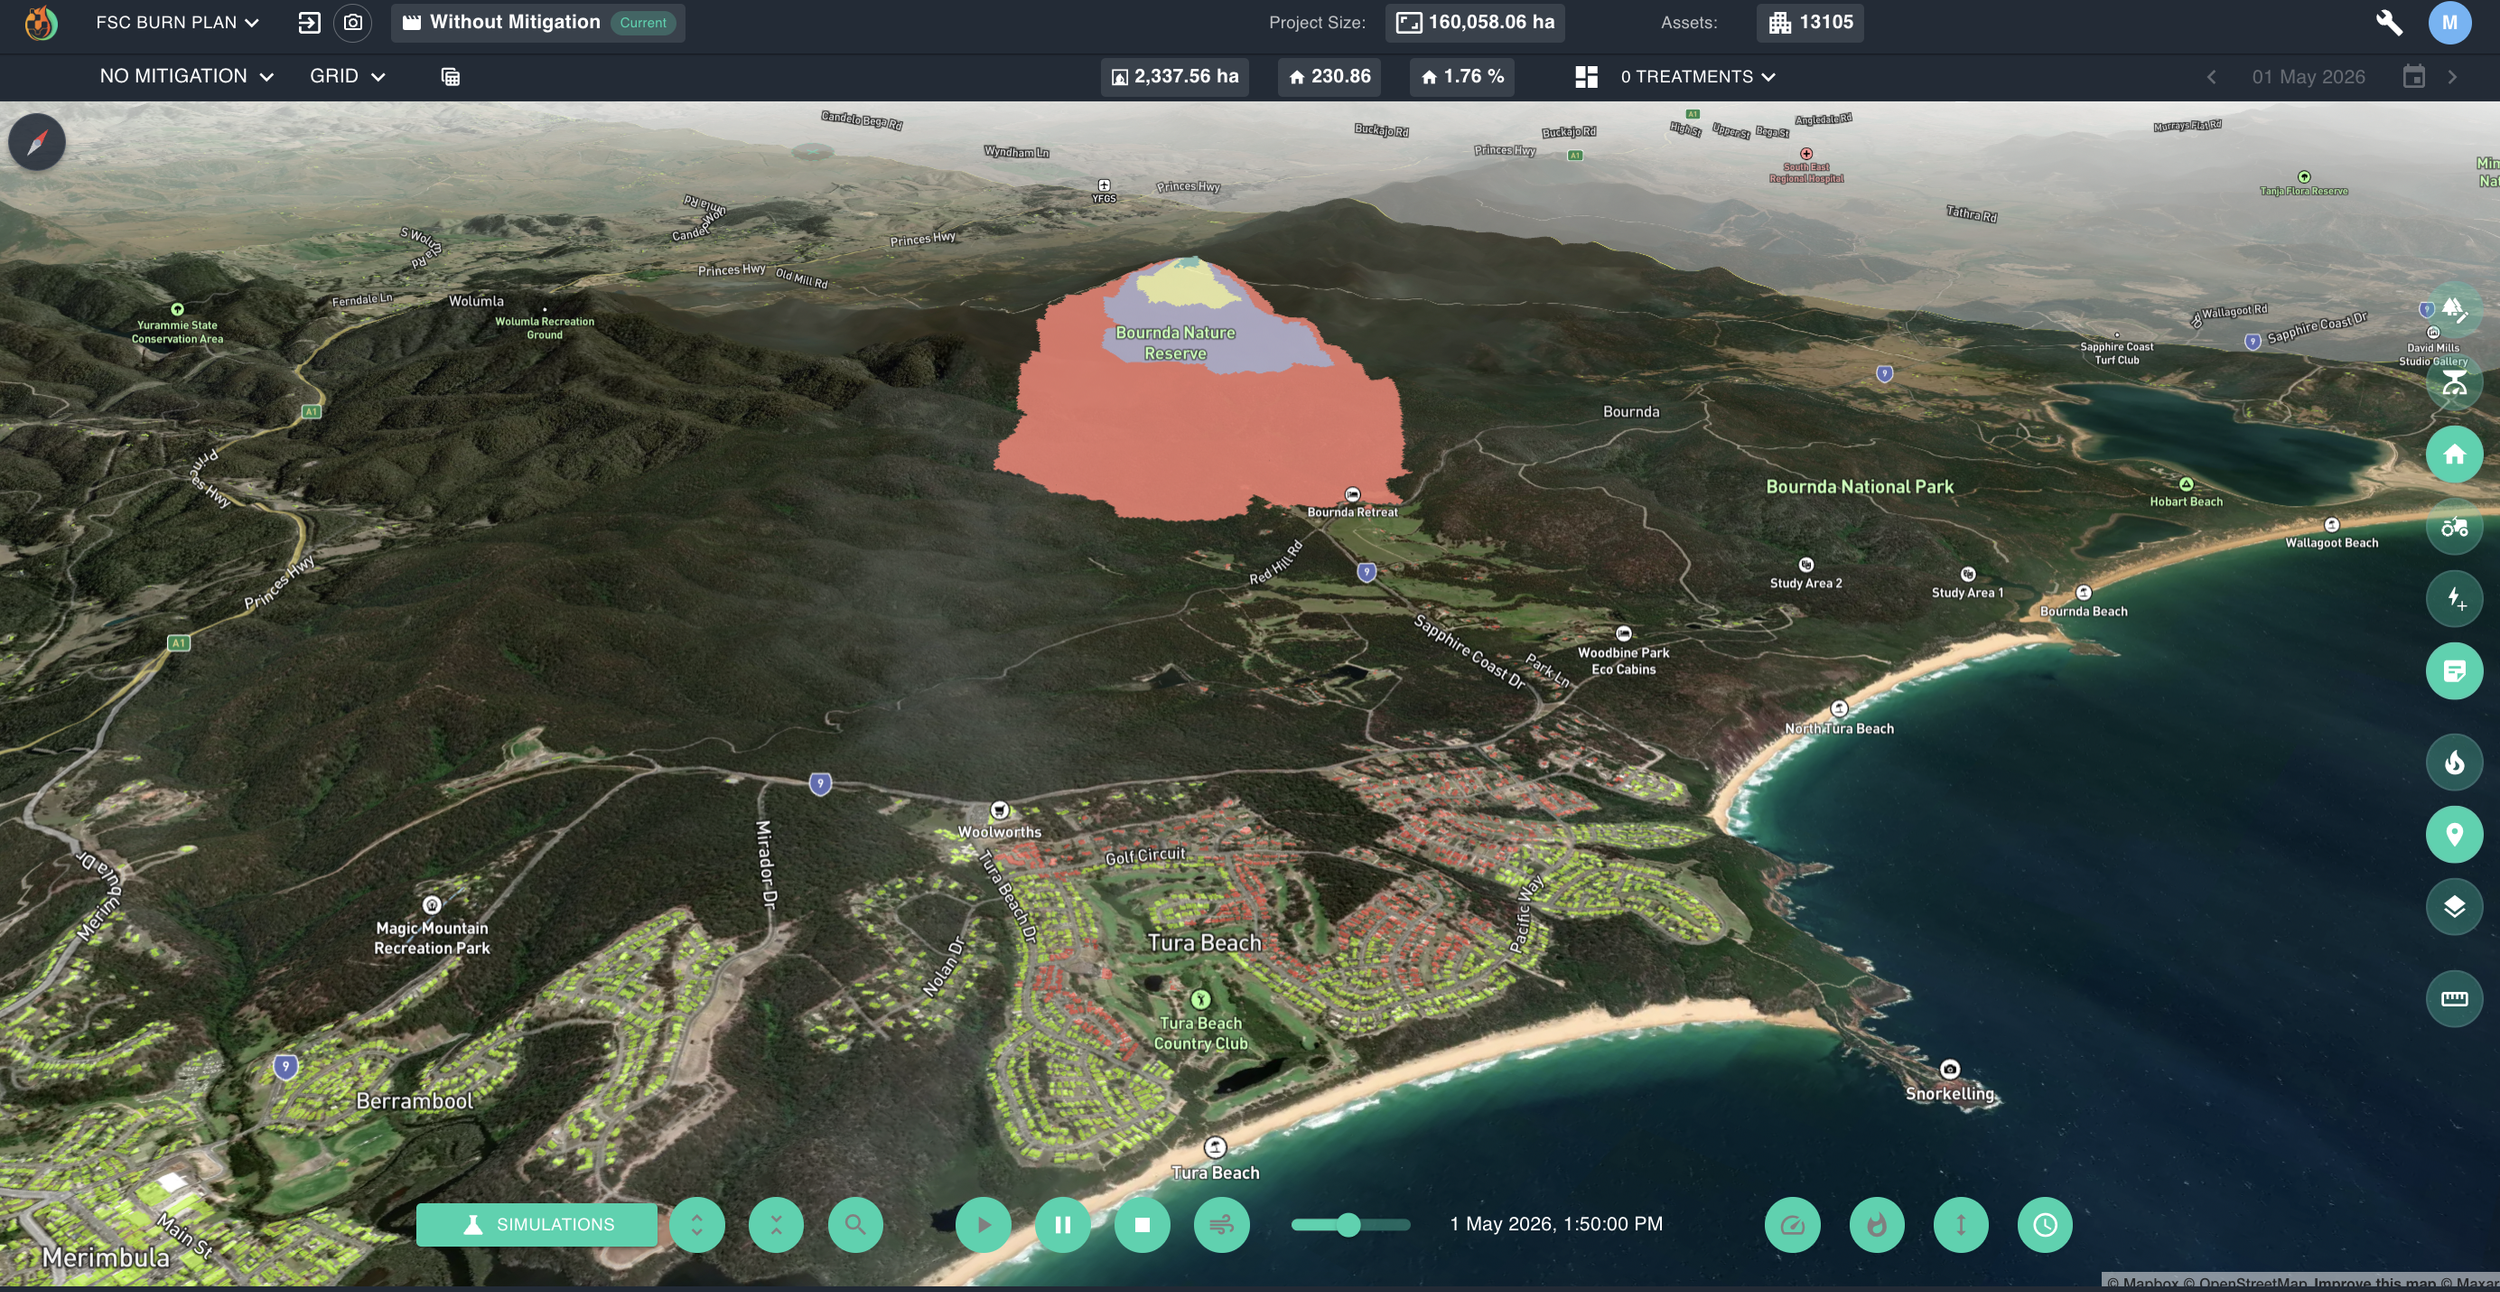
Without the autumn burn, a single ignition in Bournda Nature Reserve drives a head fire onto Tura Beach. Red houses indicate predicted impact above survivability thresholds.
In the mitigated simulation, the same ignition hits the burnt block, drops to a creeping ground fire, loses momentum and is held well short of the Tura Beach defensible line. Every one of those red houses turns green.
This is the headline result: a single, well-placed burn, in the right block, at the right scale, saves an entire neighbourhood under the worst conditions the region has experienced in living memory.
The Merimbula shield
Pull back from Bournda and look at the wider footprint and the strategy becomes obvious. Stitched together, 12 burns over the last 6 years form a near-continuous shield across the north-west approach to Merimbula and Tura Beach.
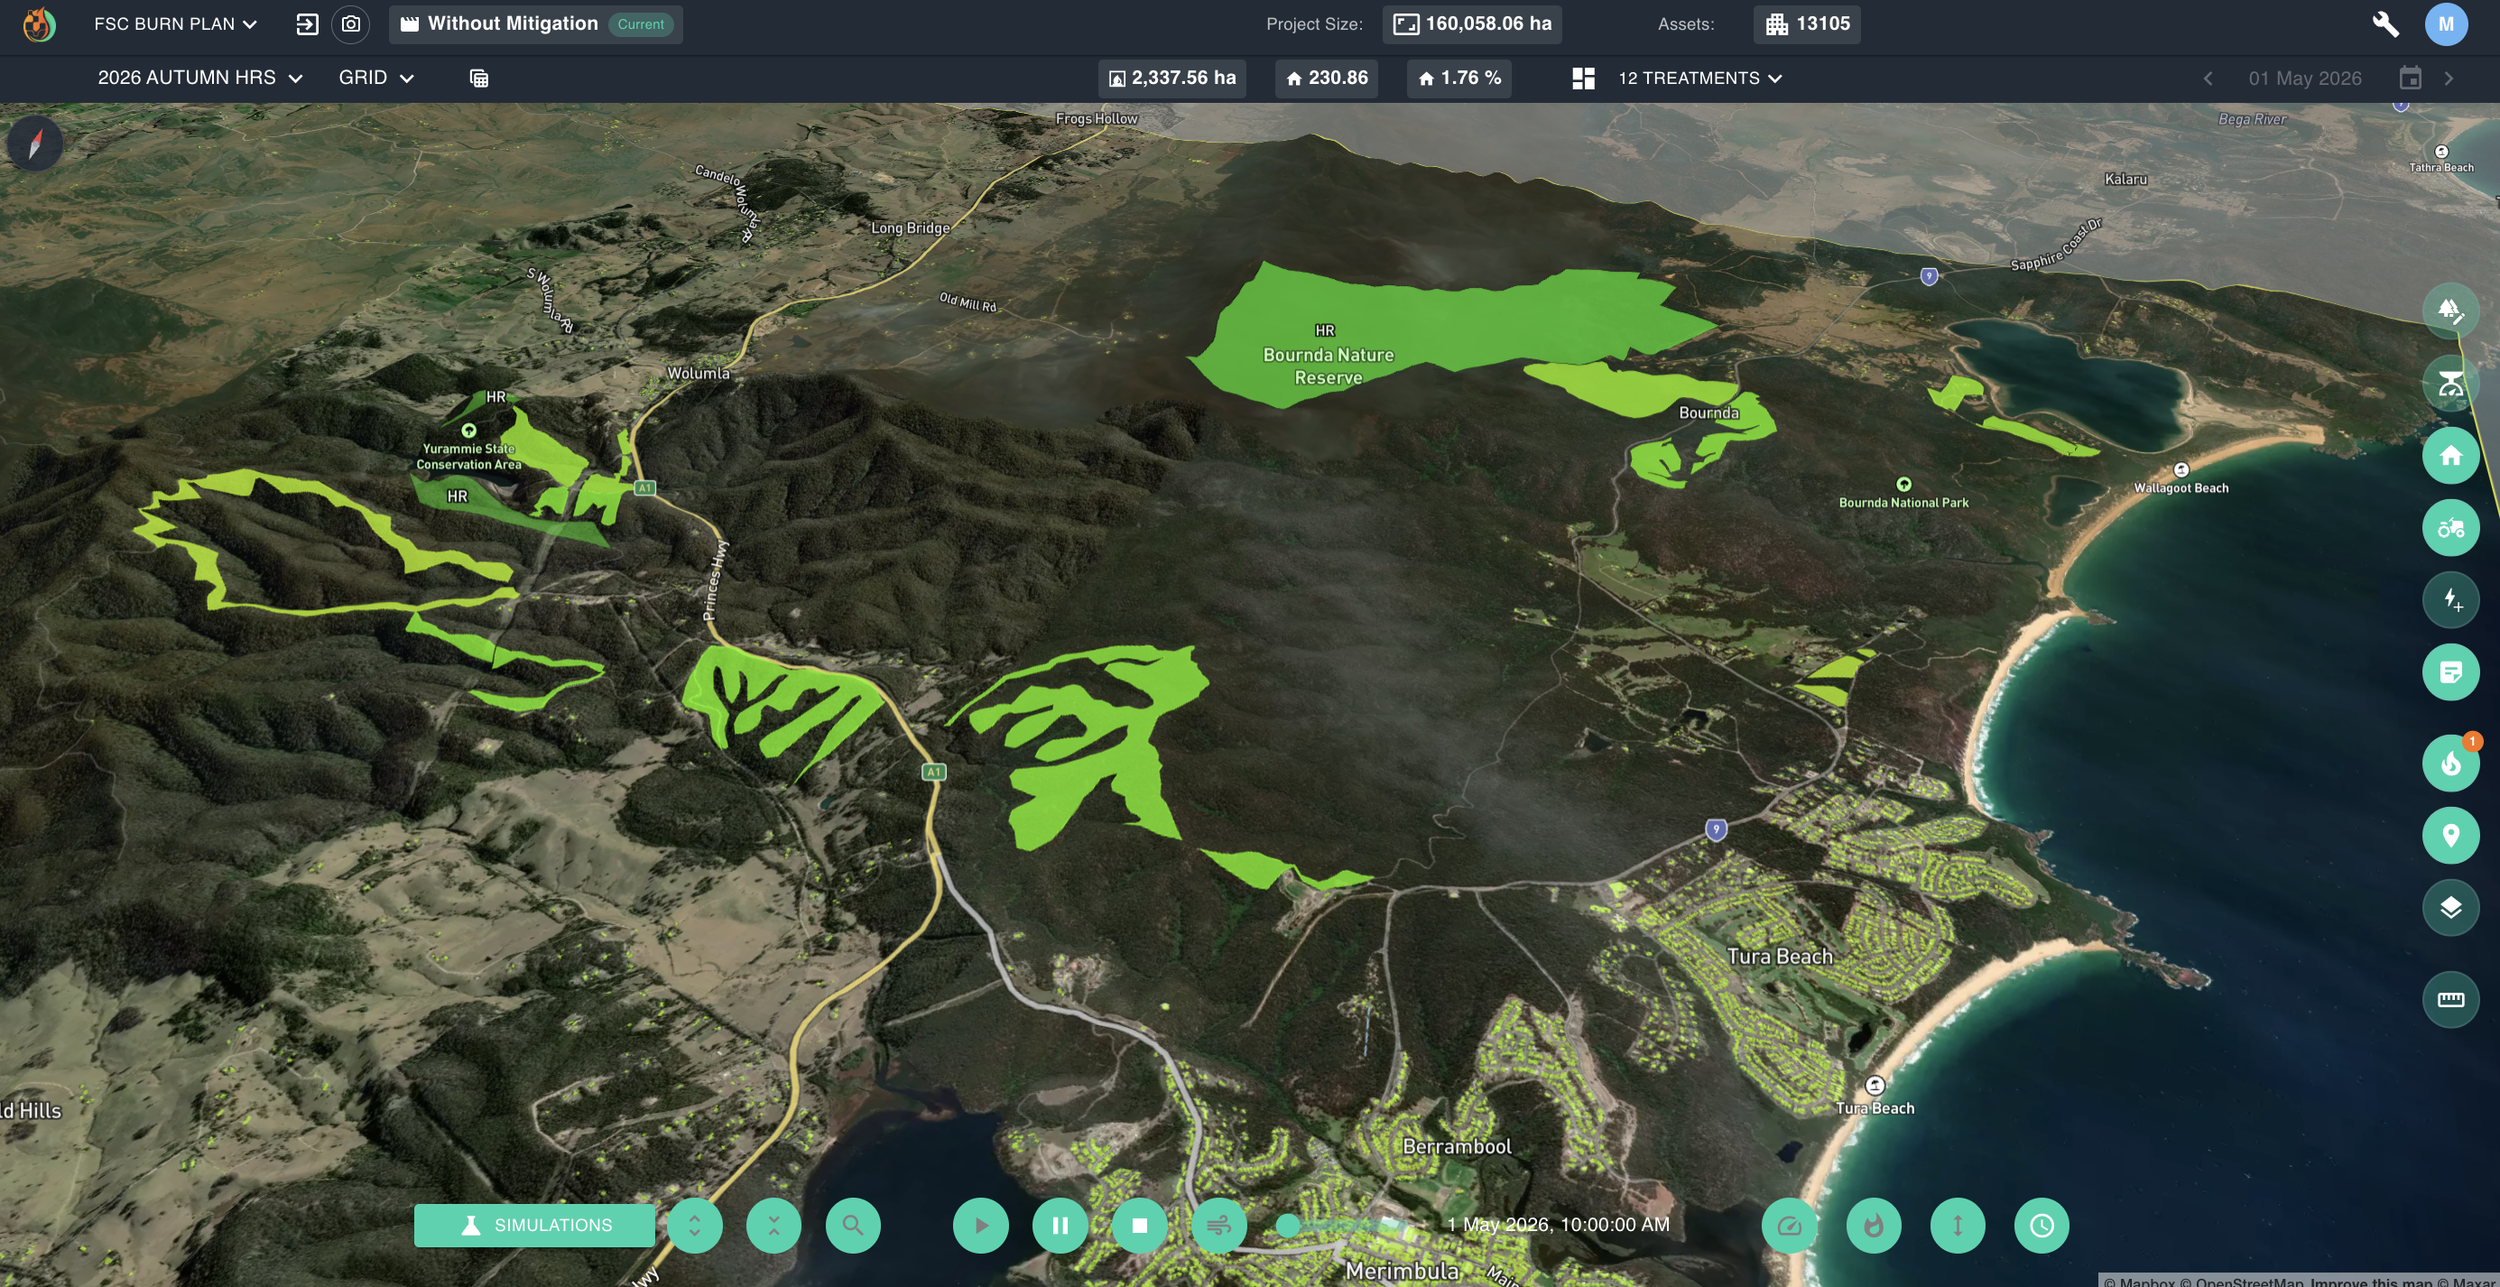
Twelve hazard reduction blocks, planned across three tenures, form a coordinated shield on the dominant NW wind axis behind Merimbula and Tura Beach.
A burn in the Yurammie State Conservation Area to the west. A long arc of burns through the ridges above the Princes Highway. The Bournda Nature Reserve block to the north. Smaller burns wrapping around the urban edge.
These are not 12 unrelated burns. Read together, they’re a coordinated strategic interlock — each block trimming the available fuel along the dominant NW wind axis that drove Coolagolite, that drove Black Summer, and that drives many catastrophic Far South Coast fires in the historical record. The burns weaken the head-fire intensity at the precise places where it would otherwise hit hardest.
That coverage doesn’t happen by accident. It is the product of three agencies, each working their tenure, planning together.
Towamba: a fire that takes the off-ramp
Move 30 km south-west of Merimbula and you find a different, equally satisfying outcome. In the no-mitigation run, an ignition north-west of Towamba develops into a heading fire that tracks south-east toward the village.
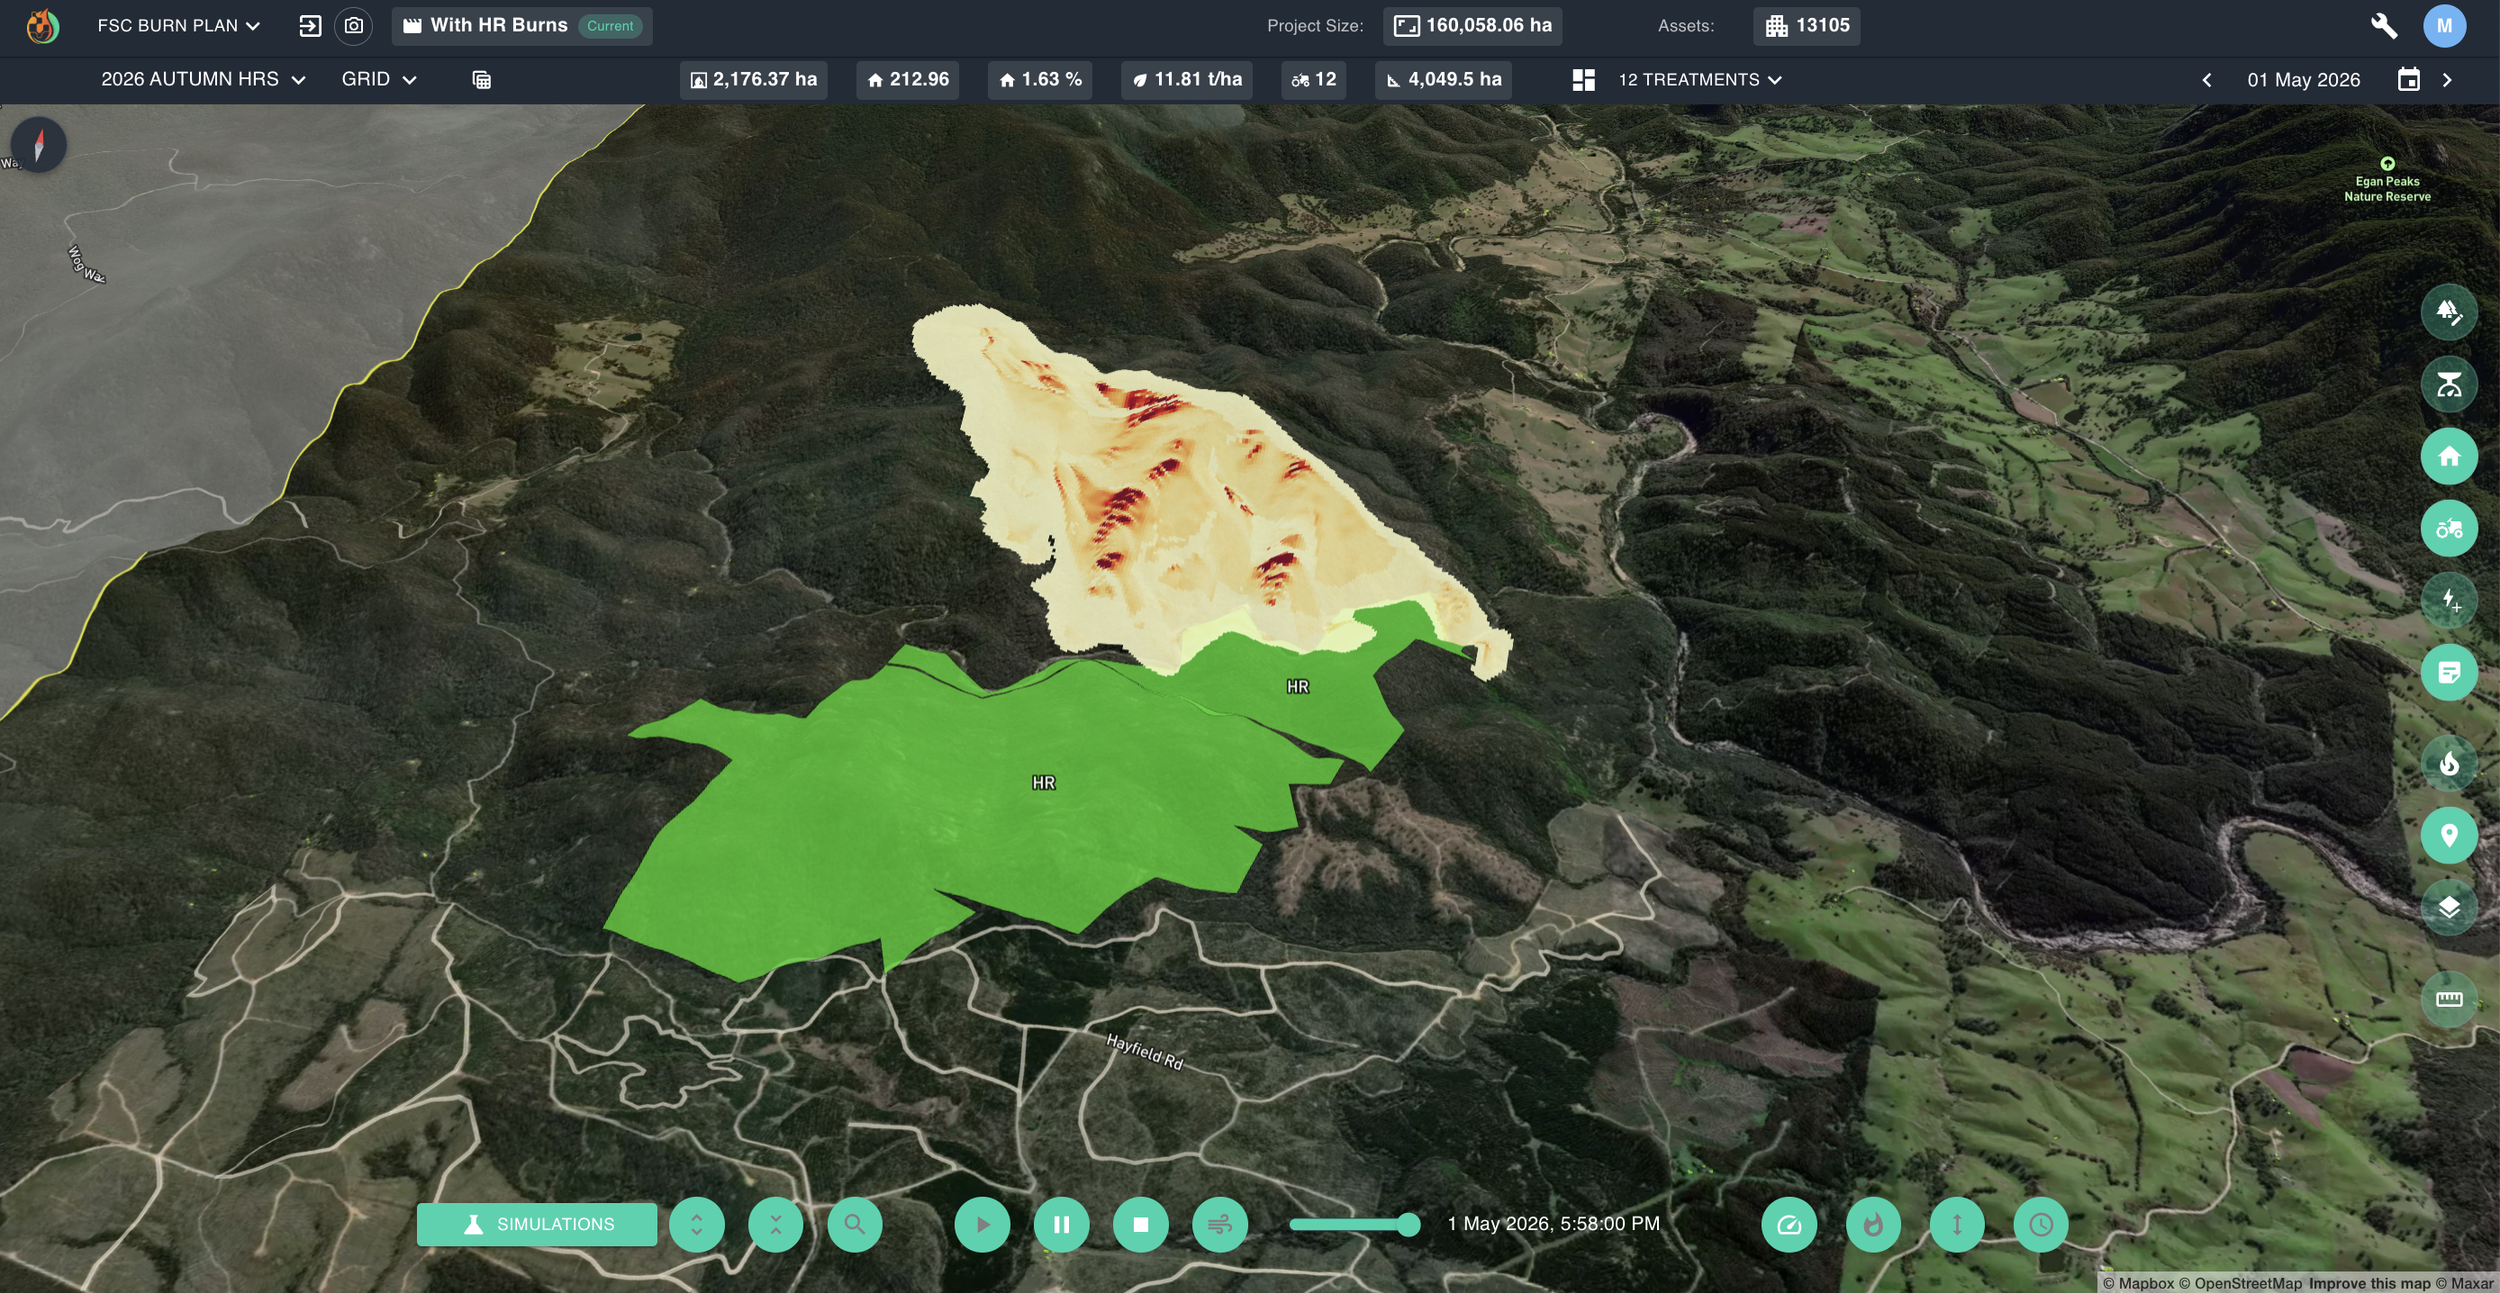
The Towamba HR block (green) stops the fire in its tracks.
In the mitigated run, that same ignition hits the edge HR block, gets squeezed onto a much narrower flank-driven track and turns away. The town never sees a head fire.
Why this matters for how we plan
For decades the answer to “did the burn work?” has come down to expert judgement, rate-of-spread tables and post-event reconstructions. Those are valuable. They are also not predictive at the scale of a whole planning unit.
What FiSci Mitigate adds is a quantitative, asset-level, scenario-based answer. For any combination of treatments, weather and ignitions, planners can now ask:
How many hectares and how many assets does each individual block save?
Which burns are doing the heavy lifting and which are marginal?
Where are the residual high-impact ignition cells — the ones we should target next?
In this project, that analysis tells us that a few burns delivered 13,700 fewer asset-impact events under Coolagolite-grade weather. It also flags exactly where next year’s program should be focused to extend the shield further.
A genuine thank-you
It is worth saying clearly. More than a thousand hectares of high-quality, strategically-placed prescribed fire is a serious piece of work. It needs windows that are dry enough to burn but mild enough to hold; crews on stand-by for weeks at a time; helicopter and machinery hours; community and neighbour liaison; and the experience to know when to light — and when to walk away.
The crews from FCNSW, RFS and NPWS who put this autumn’s program on the ground have measurably reduced the worst-day risk to thousands of homes across the Far South Coast.
See your burn program in numbers.
If you’d like to see how FiSci Mitigate can quantify the value of your burn program — past, present or proposed — we’d love to show you. Get in touch at fi-sci.ai.