
Dynamic
Risk that moves when the landscape does
Mitigate integrates real-time environmental and operational data, so risk assessments adapt as conditions change rather than ageing quietly in a PDF.
The platform
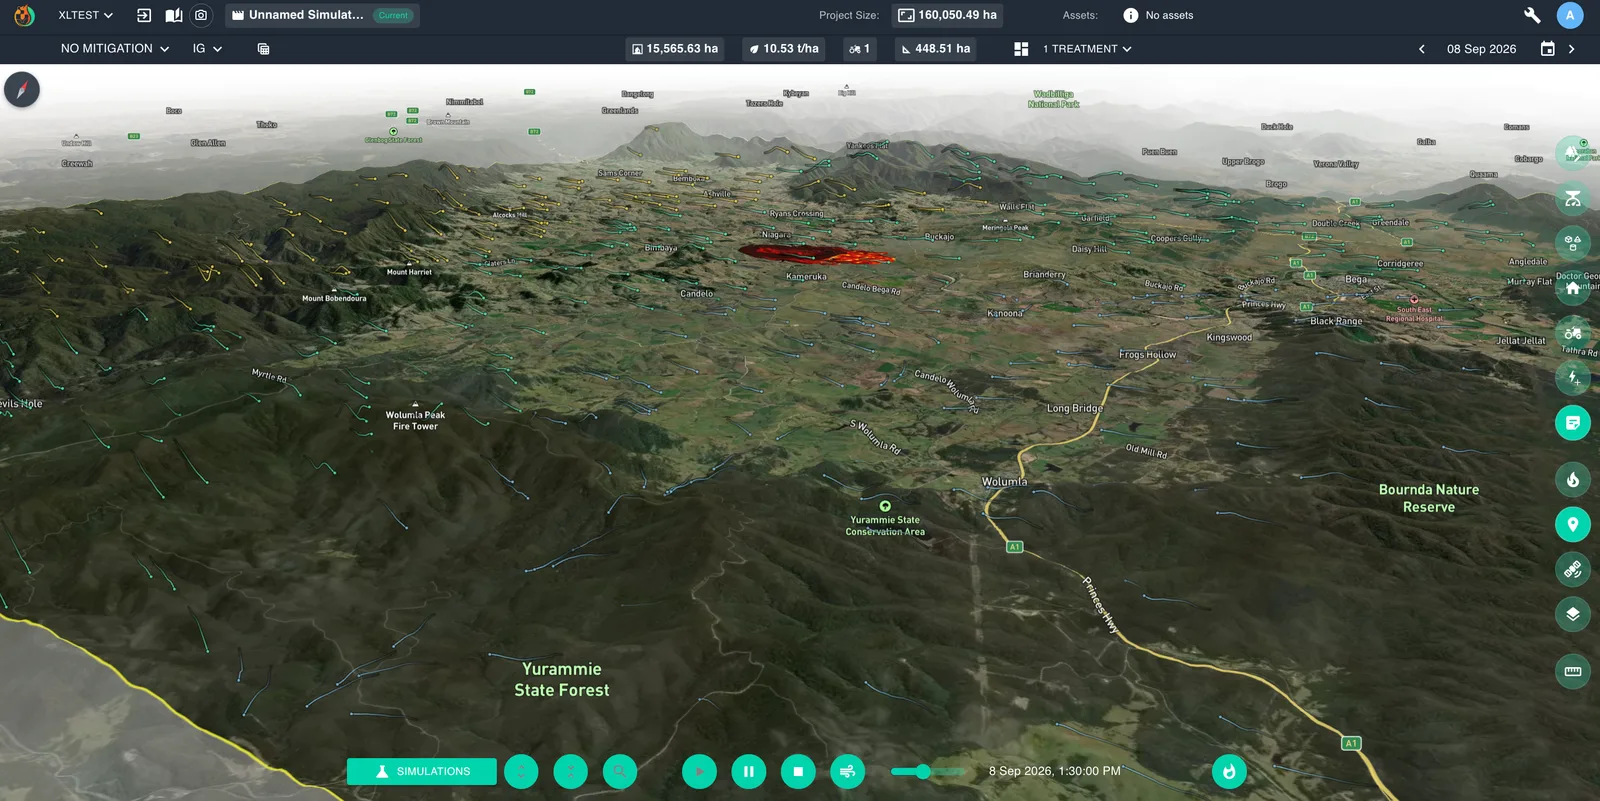
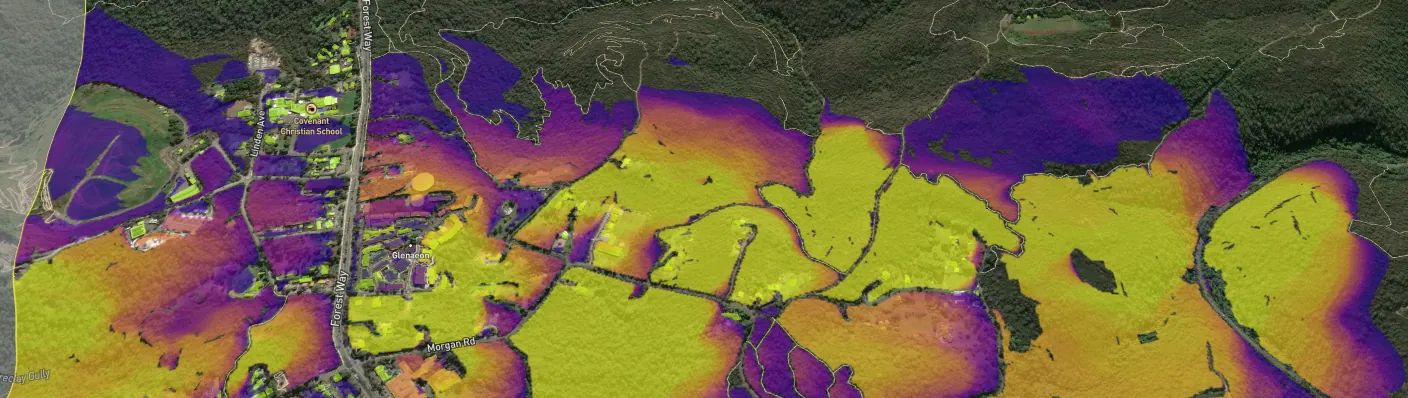
Mitigate turns a landscape into a model you can interrogate — where fire will start, where it will run, what it will hit, and which treatment programme changes that most per dollar spent.
Live simulation·Northern Beaches, NSW
What it gives you
Dynamic
Mitigate integrates real-time environmental and operational data, so risk assessments adapt as conditions change rather than ageing quietly in a PDF.
Speed to insight
A cloud platform your own team drives. Analyse bushfire risk independently and in minutes, so resourcing decisions can be made while they still matter.
What-if scenarios
Explore mitigation options and see their effect on risk. Optimise resource use, minimise financial exposure and keep strategy aligned with ecological practice.
Evidence over instinct
Machine learning over complex spatial datasets produces recommendations you can show a board, a regulator or a neighbour — and explain.
Descriptive
Clean, transparent baseline layers. Used alone they invite guesswork — which is exactly why they are the floor of the platform, not the ceiling.
Predictive
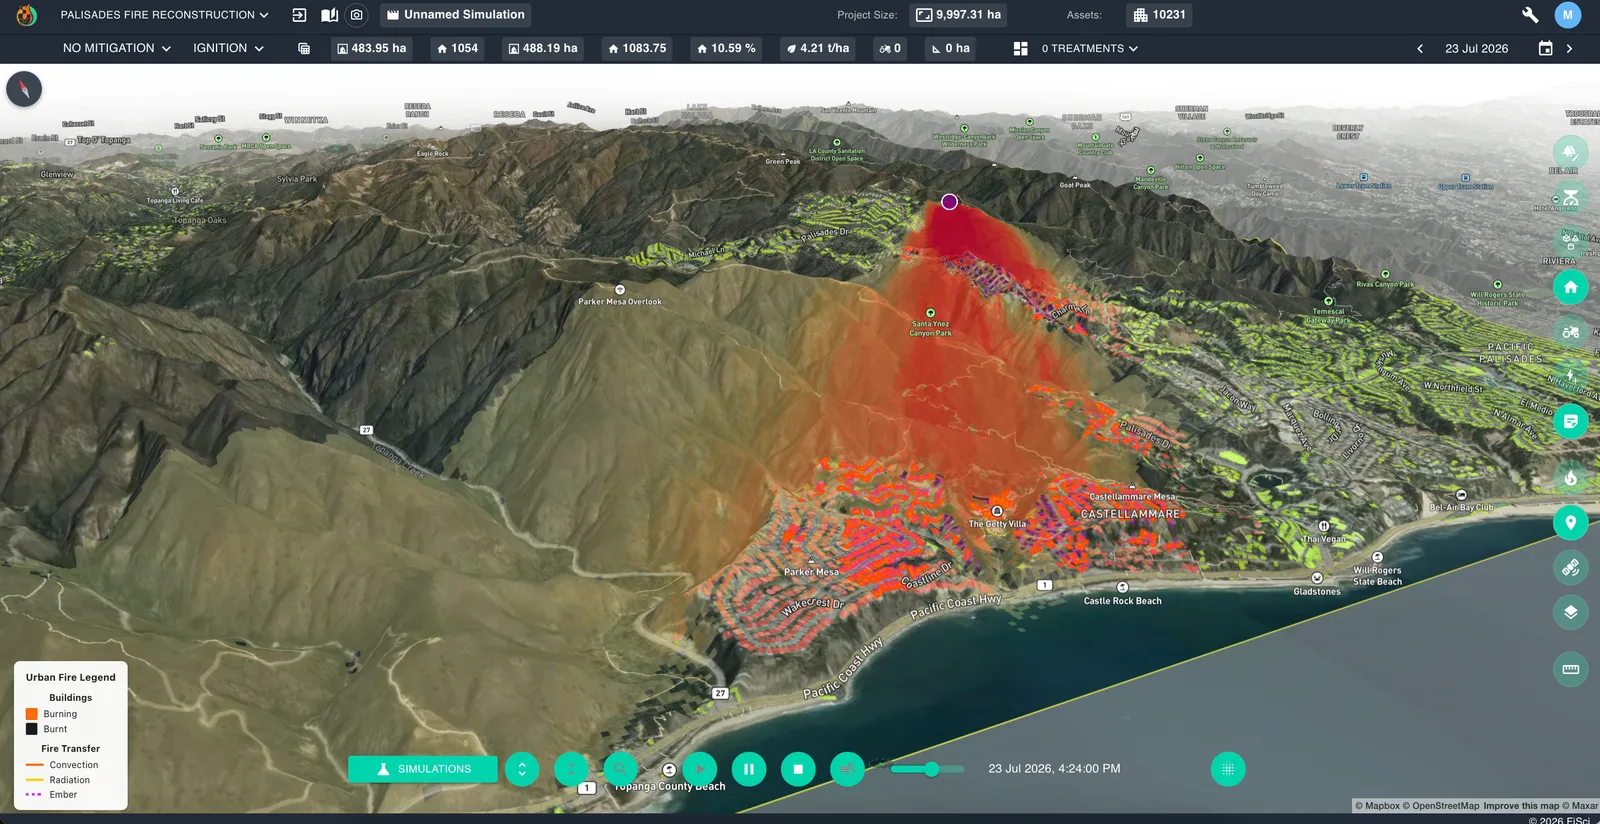
Grid the landscape with ignitions, run each one under the weather profile that worries you, and let eight hours — or several days — of physical fire behaviour play out. What comes back is a risk surface, not an opinion.
Where a fire is most likely to originate and threaten your area — including the ground outside your boundary that drives it.
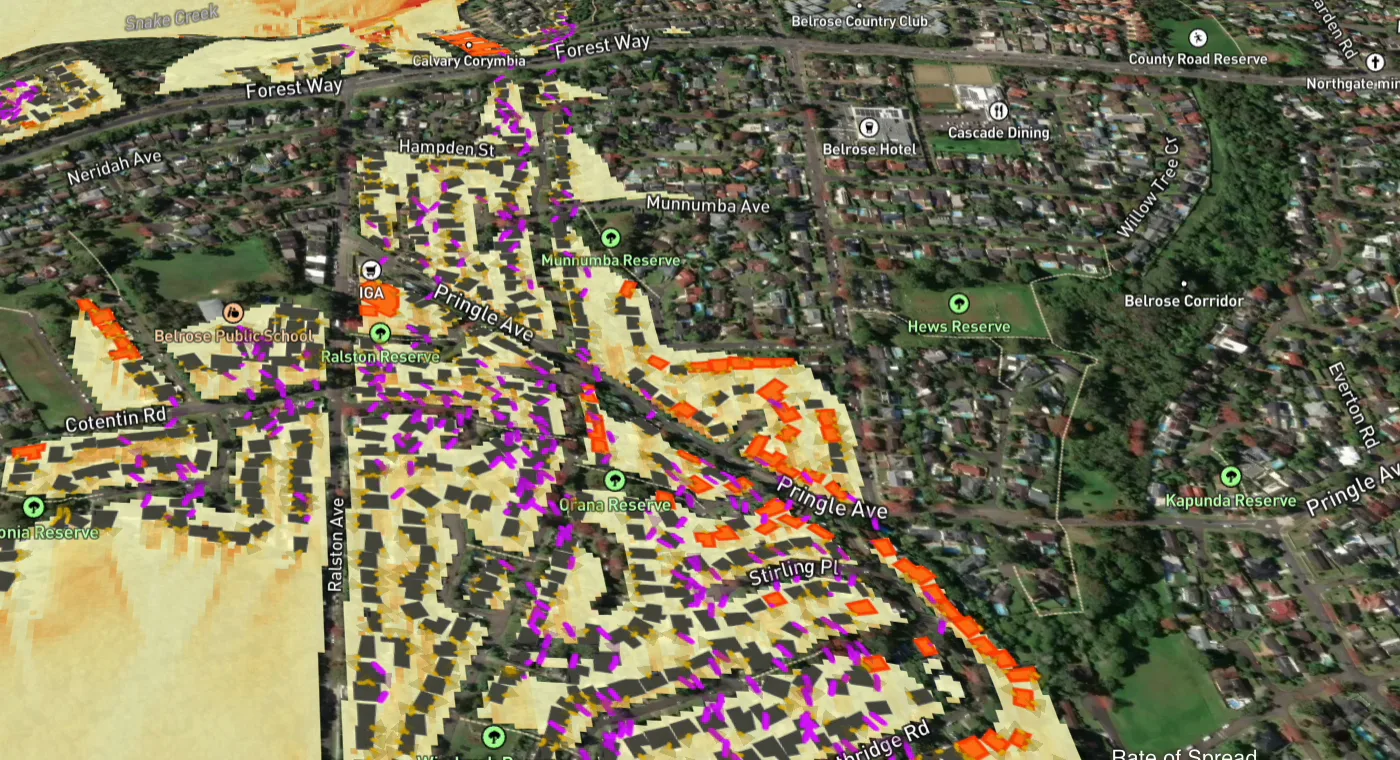
What inside your land is most exposed, and how soon it is reached. The basis for asset prioritisation.
Rate of spread, fireline intensity and flame height across the run, under wind, temperature, humidity, fuel moisture and slope you set.
Run the same scenario hundreds of times with weather, fuel and ignition varied together. The spread across members is the confidence in the answer.
Prescriptive
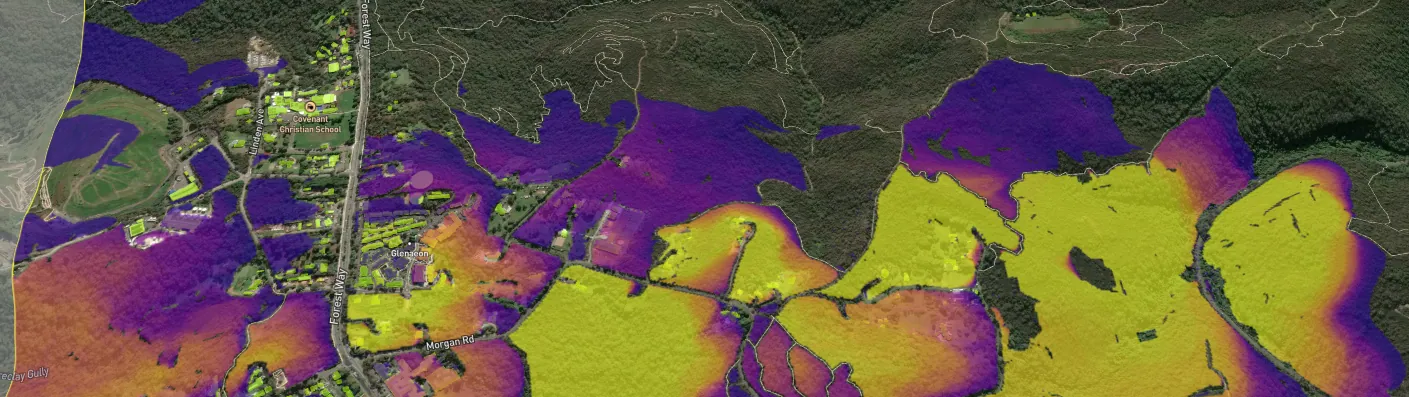
Treatments are placed, sequenced and costed, then tested against the same ignitions that produced the baseline. The difference between the two runs is the argument.
Reduce fuel load in strategic locations with controlled fire.
Manage stand structure and ladder fuels across production forest.
Slashing, mulching and machine works where fire is not an option.
Livestock managing fine fuels, especially in transitional zones.
Low-flammability vegetation and natural buffers that slow or redirect spread.
Asset-scale work around the things you cannot afford to lose.
Coverage
Country-wide vegetation and fire scar datasets wherever you operate, so the same evidence-based analysis applies whether the asset sits in the Liverpool Range, the forests of Oregon or a plantation on the other side of the world.
Contact us to schedule a demo, or ask for the technical scope if you need the detail before a conversation.